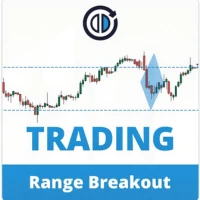
Markets do not trend and range at random intervals — they alternate between contraction and expansion. Volatility falls, coils, and then releases. A volatility contraction breakout is a trade taken on that release, and the hard part is not spotting the breakout. It is telling a real one from the dozens of fakes that happen inside a range.
What a regression channel actually measures
A linear regression channel draws the line of best fit through the last N closes, then places bands a fixed number of standard deviations either side. Two things fall out of that:
- The slope tells you the direction and strength of the prevailing drift.
- The channel width is standard deviation — a direct, non-arbitrary measure of how volatile the last N bars were.
That second point is the useful one. A moving average tells you where price has been. A regression channel tells you where price has been *and how tightly it has been holding to that path*.
Defining the contraction
Contraction is relative, not absolute. Gold at $12 of channel width is calm; EURUSD at 12 pips is not. So compare a channel to its own recent history:
Contraction = current channel width / average channel width over the last 100 bars
- Below 0.7 — meaningful contraction, worth watching
- Below 0.5 — a tight coil, the setup you actually want
- Above 1.2 — already expanding, you are late
The entry, and what confirms it
The signal is a close outside the band after a qualifying contraction — a close, not a wick. Intrabar spikes through a band are the single most common source of false entries.
Two confirmations worth requiring:
- Range expansion. The breakout bar's range should exceed the recent average. A breakout on a small bar is drift, not a release.
- Direction agreement. A break upward through the upper band while the channel slope is falling is a counter-trend trade. Sometimes right, but it is a different trade with a different win rate — do not mix the statistics.
Stop placement goes on the far side of the channel, not a fixed pip count. The channel is already scaled to current volatility, which is exactly what a stop should be scaled to. Size the position from that distance with the lot size calculator, and never widen the stop without recalculating.
Why non-repainting matters more here than anywhere else
A repainting indicator recalculates its past signals as new bars arrive. On a chart it looks extraordinary — every breakout marked perfectly, no false signals. In live trading it is worthless, because the signal you would have acted on at the time is not the signal you are now looking at.
Regression-based tools are unusually prone to this. If the channel is refitted over a window that includes bars after the signal, the breakout will always look clean in hindsight. Check it honestly: run the indicator on live data, screenshot the signal when it fires, and compare it a week later. If the arrow moved, the backtest is fiction.
The failure mode to respect
Volatility contraction is a good filter, not a prediction. Compressed ranges resolve in *some* direction, and roughly half the time it is the wrong one for your position. What contraction buys you is a tight stop relative to the move that follows — a better risk-to-reward ratio, not a better hit rate. Trade it expecting to be wrong often and paid well when right, and check the risk calculator before deciding what "paid well" needs to mean for your account.
News is the exception that breaks it. A contraction going into a scheduled release is not a coil, it is the market waiting. Sit those out.
Automating the measurement
The tedious part is comparing every channel to its own history across every symbol and timeframe you follow. Our Regression Breakout Map does that scan continuously — it plots the regression channel, scores the current contraction against its 100-bar baseline, and marks qualifying breaks only after the bar closes, so nothing on the chart moves after the fact.